How Does The Laboratory Syringe Filter Affects the Filtration Results?
Here, a Chinese engineer conducted relevant experiments.
This engineer selected filters with five different membrane materials, designed a series of experiments, and observed chromatograms of the same solution passing through these five filters. Additionally, they prepared different solutions to observe the chromatographic performance of each solution after passing through different filters. So, what are the experimental results? Let’s take a look!
The Laboratory Syringe Filters Used in His Experiment
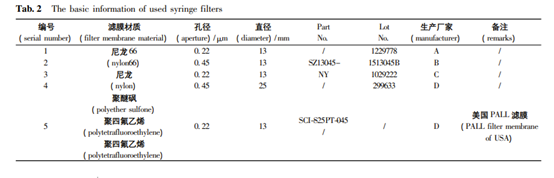
| Filter Membrane Material | Aperture /μm | Diameter | |
| 1 | Nylon 66 | 0.22 | 13 |
| 2 | Nylon | 0.45 | 13 |
| 3 | Polyether Sulfone (PES) | 0.22 | 13 |
| 4 | Polytetrafluoroethylene (PVDF) | 0.45 | 25 |
| 5 | Polytetrafluoroethylene | 0.22 | 13 |
Experimental Process
1.Instruments and Reagents
Waters e2695 / 2489 Liquid Chromatograph;
Agilent 1260 Liquid Chromatograph;
Sartorius BP211D Electronic Balance;
Orion Star pH Meter (Thermo)
Methanol and acetonitrile are both chromatography-grade (MERCK Company); Potassium dihydrogen phosphate, ammonia solution, and phosphoric acid are all analytical-grade; Water is deionized water.
2. Experimental Methods
2.1-2.3 Comparison of Three Chromatographic Conditions and Mobile Phases
| Chromatographic condition | I | II | II | |
| for Pravastatin Related Substance I | for Pravastatin Related Substance II | Related substances of Tacrolimus Capsules III | ||
| Instrument | Agilent 1260 | Waters e2695 /2489 | ||
| Column | Thermo Syncronis C18 | Phenomenex Luna 5 μm C8 ( 2) | ||
| 4.6 mm × 250 mm, 5 μm | 4. 6 mm × 250 mm,5 μm | |||
| Mobile Phase | A | 0.02mol/L KH2PO4 aq | 0.02mol/L KH2PO4 | |
| pH6.3 adjusted by ammonia solution | pH3.5 adjusted by H3PO4 | |||
| B | Methanol | Acetonitrile | ||
| Ratio | 85:15 | 45:55 | Perform linear gradient elution according to Table 1 | |
| Flow Rate | 1.0mL/min | 1.0mL/min | 1. 0 mL/min | |
| Temperature | 30℃ | 30℃ | 60℃ | |
| Detection Wavelength | 210 nm | 210 nm | 210 nm | |
| Injection Volume | 20 μL | 20 μL | 20 μL | |
Tab 2 Gradient elution program of chromatographic condition III
| Time/min | Mobile phase | |
| A% | B% | |
| 0 | 60 | 40 |
| 62 | 45 | 55 |
| 105 | 20 | 80 |
| 106 | 60 | 40 |
| 124 | 60 | 40 |
2.4 Solution to be tested
| No | Solution | Source |
| 2.4.1 | Water | Deionized Water |
| 2.4.2 | Water-Methanol Solution | Accurately measure 15 mL of methanol, place it in a 100 mL volumetric flask, and dilute with water to the mark. |
| 2.4.3 | 0. 02 mol/L KH2PO4-Methanol | Weigh 0.272 g of potassium dihydrogen phosphate, dissolve it in 100 mL of water, adjust the pH to 6.3 with ammonia solution. Take 85 mL of the solution and mix it with 15 mL of methanol. |
| 2.4.4 | 0. 02 mol/L KH2PO4-Methanol | Weigh 0.272 g of potassium dihydrogen phosphate, dissolve it in 100 mL of water, adjust the pH to 6.3 with ammonia solution. Take 45 mL of the solution and mix it with 55 mL of methanol. |
| 2.4.5 | Acetonitrile | Chromatography-grade |
2.5 Syringe filter
Result
2.6.1 Chromatographic behavior of solution “2.4.1” (Chromatographic Conditions I)
| Chromatographic condition | Solution | Syringe Filter | |
| A | I | 2.4.1 | —— |
| B | I | 2.4.1 | No.1 |
| C | I | 2.4.1 | No.2 |
| D | I | 2.4.1 | No.3 |
| E | I | 2.4.1 | No.4 |
| F | I | 2.4.1 | No.5
|
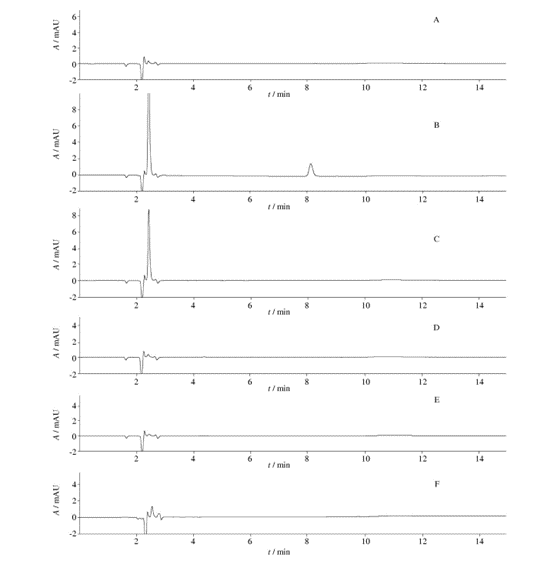
Fig. 1 HPLC chromatograms ( chromatographic condition Ⅰ,the solution of“2. 4. 1”)
From Figure 1, it can be observed that when using chromatographic condition I, the chromatograms of the unfiltered solution and the five filtrates, particularly for filtrates 3, 4, and 5, are similar to the unfiltered solution. When compared with the unfiltered solution, the chromatogram of filtrate 1 shows an increase in the number of peaks, and filtrate 2 exhibits a significant chromatographic peak. This indicates that there may be substances present when using filters 1 and 2 to filter the solution “2.4.1”.
2.6.2 Chromatographic behavior of solution “2.4.2” (Chromatographic Conditions I)
| Chromatographic condition | Solution | Syringe Filter | |
| A | 1 | 2.4.2 | —— |
| B | 1 | 2.4.2 | No.1 |
| C | 1 | 2.4.2 | No.2 |
| D | 1 | 2.4.2 | No.3 |
| E | 1 | 2.4.2 | No.4 |
| F | 1 | 2.4.2 | No.5 |
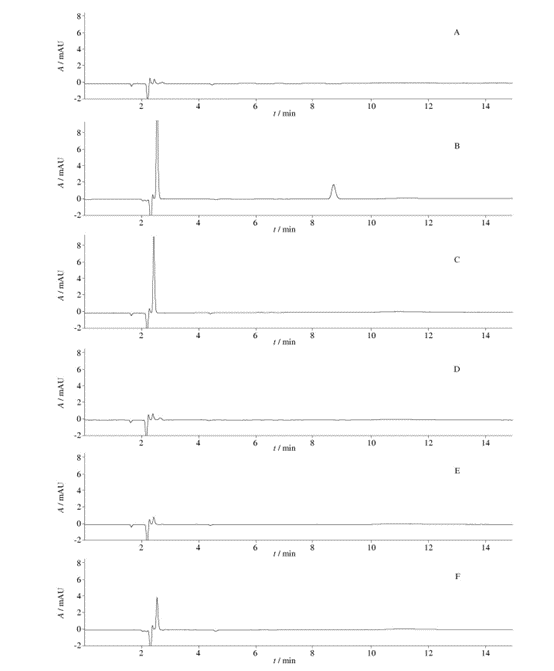
Fig. 2 HPLC chromatograms (chromatographic condition Ⅰ,the solution of“2. 4. 2”)
From Figure 2, it can be observed that when using chromatographic condition I, the chromatograms of the unfiltered solution and the five filtrates, particularly for filtrates 3 and 4, are similar to the unfiltered solution. When compared with the unfiltered solution, the chromatogram of filtrate 1 shows an increase in the number of peaks, and filtrate 2 exhibits a significant chromatographic peak. This indicates that there may be substance precipitation when using filters 1 and 2 to filter the solution “2.4.2”.
2.6.3 Chromatographic behavior of solution “2.4.3” (Chromatographic Conditions I)
| Chromatographic condition | Solution | Syringe Filter | |
| A | I | 2.4.3 | —— |
| B | I | 2.4.3 | No.1 |
| C | 1 | 2.4.3 | No.2 |
| D | 1 | 2.4.3 | No.3 |
| E | 1 | 2.4.3 | No.4 |
| F | 1 | 2.4.3 | No.5 |
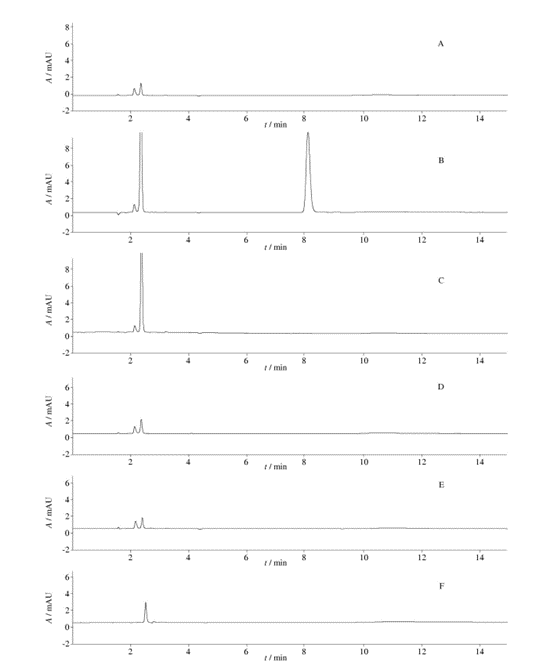
Fig. 3 HPLC chromatograms ( chromatographic condition Ⅰ,the solution of“2. 4. 3”)
From Figure 3, it can be observed that when using chromatographic condition I, the chromatograms of the unfiltered solution and the five filtrates, particularly for filtrates 3 and 4, are similar to the unfiltered solution. When compared with the unfiltered solution, the chromatogram of filtrate 1 shows an increase in the number of peaks, and filtrate 2 exhibits a significant chromatographic peak. This indicates that there may be substance precipitation when using filters 1 and 2 to filter the solution “2.4.3”.
2.6.4 Chromatographic behavior of solution “2.4.4” (Chromatographic Conditions II)
| Chromatographic condition | Solution | Syringe Filter | |
| A | II | 2.4.4 | —— |
| B | II | 2.4.4 | No.1 |
| C | II | 2.4.4 | No.2 |
| D | II | 2.4.4 | No.3 |
| E | II | 2.4.4 | No.4 |
| F | II | 2.4.4 | No.5 |
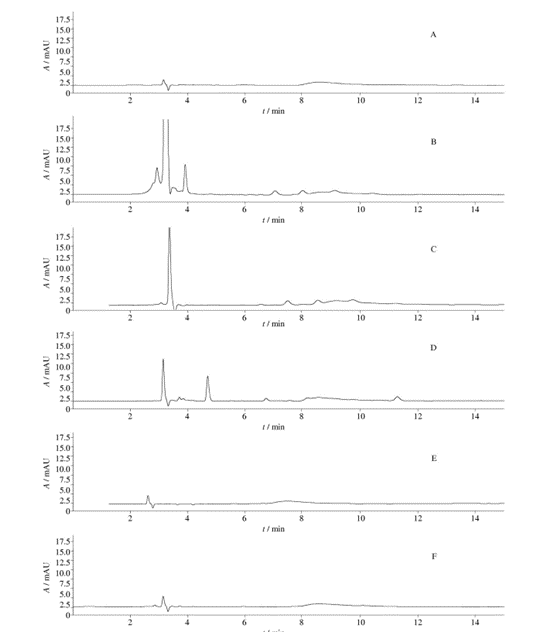
Fig. 4 HPLC chromatograms ( chromatographic condition Ⅱ,the solution of“2. 4. 4”)
From Figure 4, it can be observed that when using chromatographic condition II, the chromatograms of the unfiltered solution and the five filtrates, particularly for filtrates 4 and 5, are similar to the unfiltered solution. When compared with the unfiltered solution, the chromatogram of filtrates 1 and 3 shows an increase in the number of peaks and peak areas, and filtrate 2 exhibits an increase in peak area. This indicates that there may be substance precipitation when using filters 1, 2, and 3 to filter the solution “2.4.4”, with filters 1 and 3 having a greater impact on chromatographic peaks.
2.6.5 Chromatographic behavior of solution “2.4.5” (Chromatographic Conditions III)
| Chromatographic condition | Solution | Syringe Filter | |
| A | III | 2.4.4 | —— |
| B | III | 2.4.4 | No.1 |
| C | III | 2.4.4 | No.2 |
| D | III | 2.4.4 | No.3 |
| E | III | 2.4.4 | No.4 |
| F | III | 2.4.4 | No.5 |
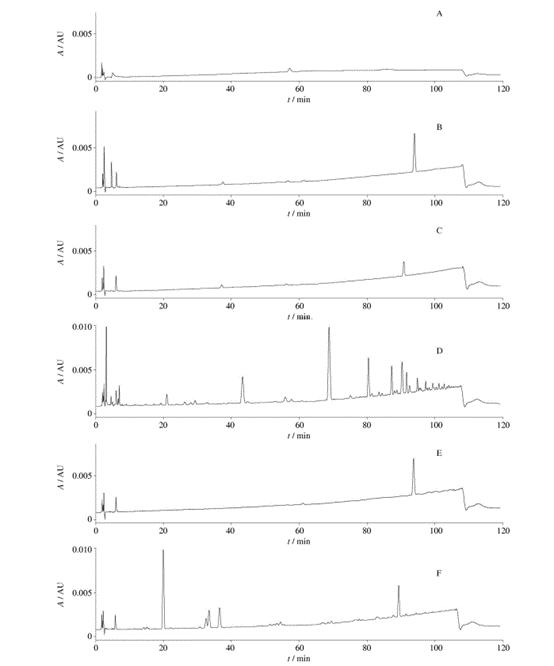
Fig. 5 HPLC chromatograms (chromatographic condition Ⅲ,the solution of“2. 4. 5”)
From Figure 5, it can be observed that when using chromatographic condition III, the chromatograms of the unfiltered solution and the five filtrates show detected chromatographic peaks. When compared with the unfiltered solution, all five filtrates exhibit chromatographic peaks, with filtrate 3 having the most peaks and filtrate 2 having relatively fewer peaks. This indicates that there may be substance precipitation when using all five filters to filter the solution “2.4.5”, with filter 3 having the most significant impact on chromatographic peaks and filter 2 having the least impact.
Collusion
Using chromatographic condition I, different filtrates of water, 15% methanol solution, and mobile phase solution filtered through different membrane filters were injected separately. The results show that filtrates 1 and 2 exhibit significant differences in chromatographic peaks compared to the unfiltered solution. Filtrate 1, with nylon membrane, increases the number of peaks while enlarging the solvent peak area. Filtrate 2, with another type of nylon membrane, increases the solvent peak area. This indicates that both types of nylon membranes generate substances when filtering the three test solutions.
Using chromatographic condition II, the mobile phase solution filtered through different membrane filters was injected. The results show that filtrates 1, 2, and 3 exhibit significant differences in chromatographic peaks compared to the unfiltered solution. Filtrates 1 and 3, both with nylon membranes, increase the number of peaks while enlarging the solvent peak area. Filtrate 2, with another type of nylon membrane, increases the solvent peak area. This indicates that both types of nylon membranes and the polyethersulfone membrane generate substances when filtering the test solution.
Using chromatographic condition III, acetonitrile filtered through different membrane filters was injected. The results show that all five filtrates exhibit differences in chromatographic peaks compared to the unfiltered solution. Filtrate 3 has the most chromatographic peaks, while filtrates 2 and 4 have relatively fewer peaks. This indicates that membranes made of nylon, polyethersulfone, and polytetrafluoroethylene generate substances when filtering the solution, with polyethersulfone and polytetrafluoroethylene (filter 5) having a significant impact on chromatographic peaks.
Excerpt from the article: Drug Standards of China 2018,19( 5), 409-416
Author: YAO Yongqing,LI Qian,LIU Ying* ( Henan Institute for Food and Drug Control,Zhengzhou 450016,China)